Canada’s pool industry grows for third straight year
by jason_cramp | April 10, 2020 3:47 am
By Jason Cramp
 [1]Editor’s note: This is our 42nd annual report on the state of the Canadian pool industry, including statistical information and market analysis. Information is based on Statistics Canada’s building permit records for swimming pools with an overview of new pool permits for census metropolitan areas (CMAs). The figures are conservative and do not reflect many of the rural areas that do not require building permits for pool construction.
After slight growth in 2018, the Canadian swimming pool market, based on the number of permits issued, continued its positive upward trend in 2019. In fact, the total number of permits recorded last year was the second highest in the last 20 years, ranking only behind 2016 (13,054). When reflecting on last year’s report, especially with respect to the apparent trends, the longest streak the Canadian pool industry has strung together in the last 15 years in regard to a year-over-year increase in building permits remains three, which has now happened twice in the past six years (2010-2012 and 2017-2019). Both times the third year was the most successful. That said, heading into the 2020 season this may be the year where we see this streak continue.
Despite labour shortages, technological changes, continuing trade tensions, and rising interest rates being some of the top concerns in 2019, not to mention the fluctuating consumer confidence index and strange weather patterns, which seem to be becoming the norm, the number of pool permits registered last year increased by 3.8 per cent over 2018.
This is a positive result considering The Conference Board of Canada reported in January 2019 the consumer confidence index remained weak[2]—based on the levels seen in the two previous years—and, much like 2018, Canadians remained hesitant about making major purchases.
Acclimatizing to a new norm
In taking the results of Pool & Spa Marketing’s recent industry survey (see page 42) into consideration, specifically the response to the question on what affects the industry more—the weather or the economy, the latter appears to be a determining factor in the success of any pool season. It is a given, a homeowner needs to be financially secure to purchase a swimming pool and, depending on each customer’s situation, this decision can be made at any time. That said, it is rare for these two factors to ever be in sync as purchasing a pool can be planned and, simply put, the weather cannot. As a result, when climate conditions are not conducive to building pools, it can grind the industry to a halt.
According to Environment and Natural Resources Canada, the country faced a frigid winter with tons of snow, while the summer was filled with lots of rain with the occasional heat wave. Although spring and fall were short-lived, these seasons packed a lot of punch with respect to the weather extremes that occurred[3].
Similar to the almost non-existent seasonal transitions experienced in 2018, last year was much the same; however, this time, when summer finally arrived, it did not pack much heat. That said, it was the country’s 23rd “not-cold” year in a row, but it was not as warm as what was experienced in much of the past 10 years. For millions of Canadians, it was not that 2019 was so cold—it just was not hot[4]. What did this mean for the number of pool installations in 2019? Despite temperatures across Canada being slightly below average—thanks to an extremely cold February—pool permits still increased year-over-year during the first five months of 2019. In fact, this streak lasted for six months when taking into consideration the increase in permits in December 2018. This was promising for the industry seeing as though these permits were recorded during the winter and spring. This may come as a surprise since many pool companies go into hibernation during the off-season, while a good start to the spring is generally a positive sign for builders as they gear up for the summer.
That said, although permits increased year-over-year in May, the hot weather that usually coincides with June, July, and August was void and it became a wet, soggy summer without any sustained heat. As a likely result, permits increased in only one of these three months last year. Coincidentally, the consumer confidence index decreased month-over-month in June, rose in July (the same month permits increased), and fell again in August. Needless to say, between July 2018 and July 2019 pool permits decreased year-over-year only twice within these 13 months. However, when comparing the two years more systematically, the first three quarters of 2019 were up 7.3 per cent, 7.9 per cent, and 1.7 per cent, respectively. The final quarter was down year-over-year by 14.7 per cent.
When breaking up last season into three categories: start of year/early spring (January to April); mid-spring/late summer (May to August); and fall/winter (September to December), pool permit registrations were only down in the last category. They increased by 18.3 per cent in the first category and 2.1 per cent in the second.
Overall, Statistics Canada reported 12,685 permits were issued in 2019, representing 461 more than the year prior. Permit registrations in census metropolitan areas (CMAs) also increased year-over-year by 5.4 per cent, representing 477 more permits than in 2018.
Top five major urban centres with increased building permit registration in 2018 |
|||
|---|---|---|---|
| Region | 2018 | 2019 | (+) Change |
| Ottawa—Gatineau (Quebec part) |
175 | 584 | 409 |
| Montreal | 4302 | 4478 | 176 |
| Halifax | 55 | 158 | 103 |
| Sherbrooke | 408 | 457 | 49 |
| Kitchener-Cambridge-Waterloo | 126 | 170 | 44 |
Top five major urban centres with decreased building permit registration in 2019 |
|||
|---|---|---|---|
| Region | 2018 | 2019 | (-) Change |
| Hamilton | 506 | 271 | 235 |
| Kelowna | 233 | 192 | 41 |
| St. Catharines-Niagara | 221 | 187 | 34 |
| Calgary | 46 | 13 | 33 |
| Brantford | 47 | 19 | 28 |
Regional activity
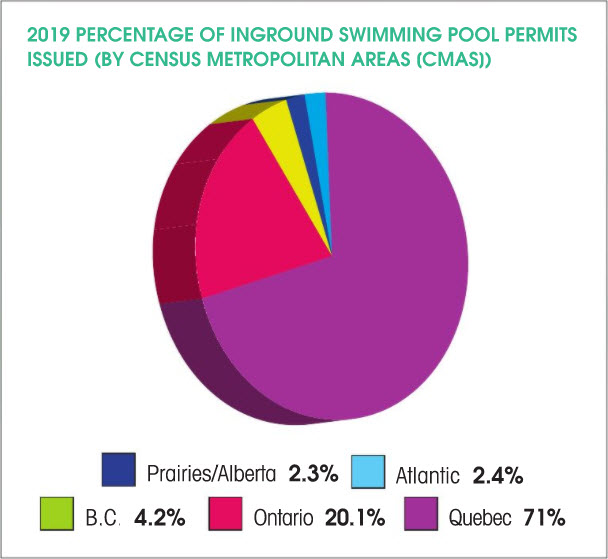
In 2018, permit registration increases and decreases were spread out amongst the country and the CMAs within it. In 2019, however, the tables turned as a definite line could be drawn as one moved east to west across the country. That said, 73.8 per cent of all permit registrations occurred in Atlantic Canada and Quebec, representing a year-over-year increase of 9.4 per cent (807 permits). Permits registered between Ontario and British Columbia was down by 9.4 per cent year-over-year (346 permits).
Due to sheer population, Ontario and Quebec are the country’s largest regions for pool installations and, thus, are more susceptible to large decreases or increases in pool permit registrations. Unfortunately, unlike last year, the latter did not occur in both provinces. Together, they represent 91.8 per cent of the 2019 Canadian pool market, representing a 0.3 per cent year-over-year increase.
Although pool permits were up by almost four per cent in 2019, one of the biggest reasons for this was the turnaround season seen in the Maritimes. In 2018, only one of four CMAs reported positive growth whereas, in 2019, all four saw increased permit registrations. All five CMAs in Quebec also had increases in pool permits. In contrast, Ontario had five CMAs reporting increases in 2019, which is a far cry from the 11 CMAs with increased permits in 2018, while western Canada went from six to one CMA having positive gains, representing a 10.7 per cent year-over-year decrease. (See the chart ‘Building Permits Issued for Swimming Pools in Census Metropolitan Areas (CMAs) 2007-2019 on page eight for details on specific municipalities).
Building Permits Issued For Swimming Pools in Census Metropolitan Areas (2015-2019) |
|||||
|---|---|---|---|---|---|
| Region | 2015 | 2016 | 2017 | 2018 | 2019 |
| Canada | 10698 | 13054 | 12067 | 12224 | 12,685 |
| Abbotsford-Mission | 6 | 10 | 5 | 10 | 15 |
| Barrie | 163 | 248 | 118 | 94 | 66 |
| Belleville | — | — | 4 | 17 | 10 |
| Brantford | 59 | 30 | 39 | 47 | 19 |
| Calgary | 36 | 31 | 39 | 46 | 13 |
| Chicoutimi-Jonquiere | — | — | — | — | — |
| Edmonton | 38 | 31 | 77 | 27 | 26 |
| Guelph | 42 | 245 | 76 | 86 | 65 |
| Halifax | 29 | 36 | 224 | 55 | 158 |
| Hamilton | 187 | 414 | 494 | 506 | 271 |
| Kelowna | 243 | 180 | 221 | 233 | 192 |
| Kingston | 36 | 51 | 36 | 45 | 53 |
| Kitchener/ Cambridge/ Waterloo |
86 | 127 | 146 | 126 | 170 |
| Lethbridge | — | — | 38 | 33 | 36 |
| London | 144 | 256 | 259 | 263 | 299 |
| Moncton | 13 | 25 | 21 | 27 | 33 |
| Montreal | 4175 | 4730 | 4272 | 4302 | 4478 |
| Oshawa | — | — | 2 | — | — |
| Ottawa/Hull/ Gatineau |
170 | 367 | 180 | 200 | 584 |
| Peterborough | 46 | 52 | 34 | 39 | 37 |
| Quebec | 463 | 598 | 612 | 753 | 793 |
| Regina | 11 | 5 | 10 | 4 | 1 |
| Saguenay | 67 | 56 | 47 | 50 | 60 |
| St. Catharines/ Niagara |
179 | 221 | 268 | 221 | 187 |
| Saint John | 15 | 18 | 33 | 8 | 16 |
| Saint John’s | 23 | 97 | 11 | 10 | 13 |
| Saskatoon | 11 | 9 | 8 | 11 | 7 |
| Sherbrooke | 386 | 481 | 409 | 408 | 457 |
| Sudbury | 89 | 159 | 108 | 121 | 107 |
| Thunder Bay | — | — | — | — | — |
| Toronto | 279 | 311 | 360 | 283 | 308 |
| Trois-Rivières | 134 | 181 | 158 | 178 | 196 |
| Vancouver | 171 | 226 | 207 | 187 | 176 |
| Victoria | 13 | 9 | 6 | 8 | 5 |
| Windsor | 106 | 134 | 191 | 238 | 215 |
| Winnipeg | 125 | 101 | 111 | 140 | 134 |
| Total Major Urban Area Permits | 7545 | 9439 | 8824 | 8776 | 9253 |
| The installation of residential swimming pools does not require a building permit in every municipality. Some areas issue permits for inground pools only. These figures are therefore conservative. Statistics Canada combined the Ottawa/Hull/Gatineau statistic. Source: Statistics Canada | |||||
Atlantic
The winter of 2019 hit this region hard, especially in February, which was the third coldest in a quarter century[5]. This was only the tip of the iceberg as the region also dealt with a polar vortex heading into spring, which resulted in only three permits being registered between January and March, which was seven fewer than 2018, but not as bad as 2016 where only one permit was issued during this period.
Over the next four months (April to July), pool permit registrations drastically increased to a point where the region was back on pace with trends seen in 2017. In fact, permits were up 87.5 per cent, from 112 in 2018 to 210 last year. This outcome was largely in part due to an increase of 107 permit registrations during the month of April in Nova Scotia.
After three years of decline, St. John’s reported an increase in permits, while other CMAs such as Moncton (up six permits), Saint John (up eight permits), and Halifax (up 103 permits and third overall in the country) also showed year-over-year increases. Further, after becoming the top CMA in the country with decreased permit registrations in 2018, Halifax has moved into the third position on the top CMAs with increased permit registrations.
Finally, New Brunswick failed to continue its upward trend with a 14 per cent decrease from the 2018 season; however, Prince Edward Island and Nova Scotia got back on track with increases of 25 per cent and 107.9 per cent, respectively.
Rounding out the year (August to December), the number of pool permits registered last year (50) was equal to those reported in 2018. Despite all of the miserable weather this region experience year round, 91 more permits were issued in Atlantic Canada in 2019 than the year prior, representing a 52.9 per cent year-over-year increase. This region represents 2.8 per cent of the total number of building permits in Canadian CMAs, which is an increase of 1.7 per cent in comparison to 2018.
Quebec
This province was hit hard by terrible weather and frigid temperatures, too. In fact, quite similar to the 2017 season, one would think the long, cold winter, and record-breaking rains would garner the same result as in 2017 with respect to pool permit registrations. In one case, for example, more than 100 mm (3.9 in.) of rainfall triggered flooding in the downtown core of several communities as the Saint François River swelled by more than 7 m (23 ft), resulting in the evacuation from hundreds of buildings[6].
Indeed, only two years removed from a season when Quebec only had one CMA with increased pool permits many would think this would be a recipe for disaster. That was not the case, however! Unlike the 2018 season which started off on the wrong foot with a 13.3 per cent decrease between January and March, during this same period last year, permits were up by 16.9 per cent. Even though summer was not as defined as it was in the previous year, it did not stop the onslaught of pool permit registrations as another 6657 (+742) were reported between April and July in 2019, representing a year-over-year increase of 12.5 per cent. Despite 827 (+12.9 per cent) more permits being issued in the first seven months of 2019 in comparison to 2018, 111 fewer permits (-5.7 per cent) were issued last year between August and December.
Although the permits dipped toward the end of the year, the total number registered last year (9096) was the most in the last 11 years. In fact, every CMA in the province had year-over-year increases between 2018 and 2019. Montreal, the largest city in this region, was up for the second year in a row by 4.1 per cent; however, it was the Ottawa-Gatineau region that had the biggest year-over-year increase at 233.7 per cent—from 107 permits registered in 2018 to 584 in 2019. Of note, Sherbrooke, the only CMA to report a decrease in pool permits in 2018, reported an increase of 12 per cent last year.
After the province’s comeback year in 2018, the region is not looking back. In fact, three CMAs are represented on the list of top areas with year-over-year permit increases, including Ottawa-Gatineau, Montreal (second consecutive year), and Sherbrooke). Quebec City, which held the first position last year for increased permits, failed to make the list; however, this CMA recorded its fifth consecutive year of permit increases in 2019. Overall, 716 more pool permits were registered in the province in 2019 compared to the year prior.
Quebec represents 71 per cent of the total number of pool building permits issued in the country’s CMAs, which is an increase of 4.2 per cent in comparison to 2018.
 [7]
[7]Ontario
Gradual seasonal changes are a thing of the past, and it would seem as though unusual weather extremes are becoming the norm—from fluctuating temperatures, rare snow days, rainstorms leading to major spring flooding, including record-high water levels in the Great Lakes, to hot and humid summer weather[8]. Based on these weather calamities in conjunction with other factors affecting the industry the numbers show this region was one of the hardest hit in 2019.
Based on the above, one might ask themselves if the market—economy and weather in all—could sustain a fourth consecutive year with permit increases between January and April. Keep in mind, it was only four years ago (2013-2015) when permit registrations during this period were on decline. That said, permits increased by 13.6 per cent in 2019 during the first four months of the year. However, in taking a closer look at the numbers, this only happened thanks to a strong April as every other month showed a decline. Further, unlike previous years where this upward trend continued throughout the year, it was short-lived last year. In fact, permits decreased by 17.5 per cent between May and August and another 6.1 per cent between September and December. Of these remaining months, year-over-year permit increases occurred twice: September (+1) and December (+5).
Of 16 reporting CMAs in the province, the results were the exact opposite from what occurred in 2018 with only five showing increases and 11 with decreased permit registrations in 2019. Indeed, three of the top five CMAs in the country showing decreased pool permit registrations are located in the province. Hamilton sits atop the list with 235 fewer permits, a year-over-year decrease of 46.4 per cent. St. Catharines-Niagara (fourth in 2018) is now third with 34 less permits (-17.6 per cent), while Brantford is ranked fifth with a decrease of 28 permits (-59.6 per cent).
That said, despite this negative outlook, Toronto had a 79.5 per cent year-over-year increase in permit registrations after a decrease in 2018. Prior to this, pool permits increased in the city for three consecutive years (2015-2017). Further, while the CMA is no longer on the list of top five CMAs with decreased permits, it has not been in the top five with increases since being bumped off the list in 2018.
Another CMA showing positive trends is Kitchener-Cambridge-Waterloo. After permits decreased in this region in 2018, they have increased in 2019 by 34.9 per cent (+40). Further, the CMA is now ranked fifth on the list of top five major urban centres with increased building permit registration in 2019.
Ontario represents 27.5 per cent of the total number of building permits issued in Canadian CMAs, representing an increase of 3.4 per cent.
 [9]Prairies
In 2018, the weather in the Prairies (Manitoba, Saskatchewan, and Alberta) varied from province to province; however, this was not the case in 2019. For instance, this region experienced one of the driest winter-spring in the last 133 years, which was compounded by the fact the record cold continued into March and April and followed by the second wettest August/September in 136 years[10]. According to Environment and Natural Resources Canada, Edmonton experienced its driest spring on record; Regina had its driest March (0.8 mm of precipitation); Saskatoon was even drier in April (0.4 mm of precipitation), while Winnipeg recorded its driest first half year (with only 91 mm of precipitation). The typical January-to-June total is 235 mm. In these cities, homeowners saw their foundations cracking, shifting, and sinking in the abnormally dry ground.
Taking the above into consideration, which affected this region’s economic structure that is dependent on agriculture, mining, and gas and oil, it was no wonder this region had a tough year with respect to pool permit registrations.
As a result, all three provinces and five of six CMAs reported decreases in pool installations last year as opposed to only three CMAs and one province in 2018. When taking a more granular look, Saskatchewan had the greatest decline with 12 less permits registered (down 52.2 per cent). One of the biggest reasons for this was both Regina and Saskatoon were down in 2019. Seven fewer permits were reported in these CMAs, representing a 46.7 per cent year-over-year decrease. The last time both of these CMAs reported decreased permits was the 2016 season.
Alberta also saw a 22 per cent decrease in permits (down 22 per cent year-over-year). Similar to the CMAs in Saskatchewan, Calgary, which had reported increases in 2017 and 2018, had a decline of 26 permits last year, representing a 71.7 per cent decrease.
It was not all doom and gloom for this province, however, as permits in Lethbridge increased by three (+9.1 per cent) over 2018. Although this represents a small year-over-year gain, at least one permit was registered in every month of the year except for February.
In 2019, each province in the Prairies region mirrored the 2016 season with no pool permit increases. This ended a two-year streak of growth in Manitoba and Saskatchewan.
Overall, the Prairies represent 2.9 per cent of the total number of building permits issued in Canadian CMAs, which is down by 0.1 per cent year-over-year.
British Columbia
This province has seen permits increase in six of the last eight years. That said, permits decreased in 2019 and, similar to the Prairies, the last time this occurred was in 2016. Some of the reasons for the decline that season were a result of extremely active wildfires and dry spells between spring and summer. This was not the case last year. In fact, wildfires were not as rampant as in the previous two years. Instead, the province faced wet weather, less extreme temperatures, and frequent cool, damp, and cloudy periods[11]. While this worked in favour of less wildfires, it certainly did not help the pool industry.
Last year, one of four CMAs in the province reported growth, while three of four had permit increases in 2018. That said, 2019 pool permits were down in the province by 8.5 per cent, representing a year-over-year decline of 47 permits. Kelowna was down by 41 permits over the 2018 season, representing a 17.6 per cent decrease. As a result, this CMA made it onto the list of the top five urban centres with decreased pool permits in 2019. For the third consecutive year, Vancouver had a decrease in permits (-5.9 per cent), while Victoria, the province’s capital, had a 37.5 per cent year-over-year decline.
The lone bright spot for British Columbia, which had an increase in pool installations in 2019, was Abbotsford-Mission. Last year, this CMA reported a 50 per cent year-over-year increase in permit registrations. It is also this region’s second consecutive year of growth.
In a year-over-year comparison, this region, as a whole, was down during the first six months of 2019 by 8.7 per cent; and again between July and December by 24.4 per cent. Overall, the province experienced an 8.5 per cent increase in pool installations in 2019, down 18 per cent over the year prior.
British Columbia represents 5.5 per cent of the total number of pool permits issued in the country’s CMAs, which is up by 0.5 per cent year-over-year.
Looking upwards
In 2019, growth in the industry, as measured by the permits for residential pools, was positive—not just in a year-over-year comparison, but also when looking back at the past 25 years. There will always be concern about discretionary spending by homeowners and whether the economy is ‘booming’ or ‘sagging.’ That said, those who have the money and have planned to install a pool will get one… it is the weather that will determine their decision as to when it will happen.
The outlook for 2020 is optimistic as many builders have reported positively about their ability to line up new customers for the coming spring.
Another positive sign is the country’s index of consumer confidence, which rose 12 points in January and another 6.5 points in February[12]. The index is now at its highest level since July 2019[13].
Finally, amid the current travel issues—whether for business or pleasure—as a result of concerns over, coronavirus (COVID-19), many people may be more inclined to stay home and spend what discretionary income they have on a backyard renovation project that includes a pool, hot tub, and landscaping to create their own ‘staycation.’ That said, an early spring will give the industry a good head start, while a great summer will increase the chances for the industry to have a fourth consecutive year of pool permit growth.
This report and all of the figures contained herein are copyright to Kenilworth Media Inc. No use may be made of this or any part of the data or reproduction of charts or graphs without the express written permission of Kenilworth Media Inc. © 2020
- [Image]: https://www.poolspamarketing.com/wp-content/uploads/2020/08/IMG_1818.jpg
- reported in January 2019 the consumer confidence index remained weak: https://www.conferenceboard.ca/e-Library/abstract.aspx?did=10124
- Although spring and fall were short-lived, these seasons packed a lot of punch with respect to the weather extremes that occurred: https://www.canada.ca/en/environment-climate-change/services/top-ten-weather-stories/2019.html#toc8
- it was not that 2019 was so cold—it just was not hot: https://www.canada.ca/en/environment-climate-change/services/top-ten-weather-stories/2019.html#toc8
- which was the third coldest in a quarter century: https://www.canada.ca/en/environment-climate-change/services/top-ten-weather-stories/2019.html#toc8
- more than 100 mm (3.9 in.) of rainfall triggered flooding in the downtown core of several communities as the Saint François River swelled by more than 7 m (23 ft), resulting in the evacuation from hundreds of buildings: https://www.canada.ca/en/environment-climate-change/services/top-ten-weather-stories/2019.html#toc8
- [Image]: https://www.poolspamarketing.com/wp-content/uploads/2020/08/IMG_3501.jpg
- including record-high water levels in the Great Lakes, to hot and humid summer weather: https://www.canada.ca/en/environment-climate-change/services/top-ten-weather-stories/2019.html#toc8
- [Image]: https://www.poolspamarketing.com/wp-content/uploads/2020/08/2019_Pool_Report_Pie_Chart.jpg
- 133 years, which was compounded by the fact the record cold continued into March and April and followed by the second wettest August/September in 136 years: https://www.canada.ca/en/environment-climate-change/services/top-ten-weather-stories/2019.html#toc8
- wet weather, less extreme temperatures, and frequent cool, damp, and cloudy periods: https://www.canada.ca/en/environment-climate-change/services/top-ten-weather-stories/2019.html#toc8
- rose 12 points in January and another 6.5 points in February: https://www.conferenceboard.ca/e-Library/abstract.aspx?did=10598
- highest level since July 2019: https://www.conferenceboard.ca/e-Library/abstract.aspx?did=10620
Source URL: https://www.poolspamarketing.com/trade/features/canadas-pool-industry-grows-for-third-straight-year/