Snow maintenance services: Best practices for meeting client expectations in property management

by Samantha Ashenhurst | November 23, 2018 9:29 am

By Phil Harwood, MBA

[1]

This author spent four years at Michigan State University (MSU) in East Lansing as an undergraduate student studying marketing. As a large university with 49,000 students, 11,000 faculty and staff, and a half-million alumni around the world, expectations for snow and ice services are high among all constituents. Students, staff, visitors, and others all expect clear sidewalks.

The campus was always very well-maintained during the summer, and the sidewalks were always cleared in time for morning classes during the winter. However, to deliver on these high expectations it required significant planning behind the scenes.

Creating a snow plan

It is not surprising to discover MSU’s landscape services department has in place a detailed snow response plan, available on its website for all to see. It is broken up into nine zones, each with a supervisor. Detailed zone maps indicate areas to be shovelled and plans for:

Further, each zone is broken up by specific use—special events, academics, housing, parking, and contracts—to facilitate better decision-making by the ‘snow response’ teams.

Inherent in all these plans are three things: capacity, cycle time, and expectations. Large properties with many constituents place significant pressure on snow and ice professionals, and require extensive planning, organization, and preparedness. An organization may or may not have this kind of pressure in its snow and ice operations, but this author guesses the expectations of its constituents are still very high. If sidewalks, roadways, and parking areas are not clear, someone will be in the hot seat. Without implementing industry best practices for determining capacity, cycle time, and understanding the related implications, it will be very difficult to consistently meet the expectations of a company’s constituents: its customers.

Meeting clients’ expectations

It is common for snow and ice management providers to overextend themselves. Some clearly know the risks of doing so but do not necessarily have the tools or understanding to effectively manage their capacity and cycle time. Capacity, cycle time, and customer expectations must be effectively managed to be successful in the snow business.

If sidewalks, roadways, and parking areas are not clear, someone will be in the hot seat.[2]
If sidewalks, roadways, and parking areas are not clear, someone will be in the hot seat.

So, exactly what is capacity? The National Hockey League’s (NHL’s) Detroit Red Wings sell out every home game. These are called capacity crowds. Capacity is what is available.

It can be easy to exceed capacity. Sometimes it cannot be helped even though everyone knows better. For example, there was controversy surrounding seating capacity at the National Football League’s (NFL’s) Cowboys Stadium for the Super Bowl in 2011. In what was seen by many as an act of greed, 15,000 temporary seats were to be installed in an effort to break the attendance record. Unfortunately, the additional seats could not be installed before game time and buyers of these seats were unable to watch the game live. Instead, they watched the game from a conference room on a screen. It is easy to oversell a capacity, especially where a lack of preparedness is involved.

One of the reasons snow contractors overextend themselves is they fail to account for client expectations. They simply count up the number of trucks they have, multiply by the cycle time they wish to achieve, and call this ‘capacity’—three trucks times five hours of cycle time equals 15 hours of capacity.

However, client expectations may have a dramatic impact on the amount of time required, which affects cycle time and resource use. In other words, client expectations are a key component of determining available capacity. However, there is a better way to determine what is required.

Calculating cycle time

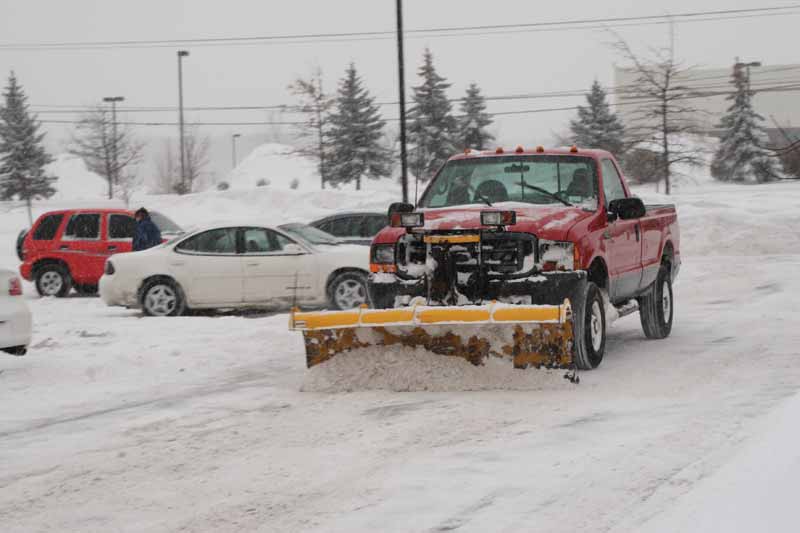
Instead of starting with capacity, start with cycle time. This is the time it takes to complete work in a specified area with a specific type and size resource. For example, cycle time is how long it takes to plow a certain property one complete time, from start to finish, or for a truck to complete its entire route for a particular event.

Once cycle time has been determined, client expectations should be factored in. What could be found is the cycle time significantly increases. Only after cycle time has been adjusted to account for client expectations can an operator determine the amount of demand a property requires—how much capacity it will use up to meet this demand.

In terms of cycle time for an entire fleet and overall capacity, it is important to know the total capacity, to recognize if this is fixed, and to recognize there is only one point where it intersects with demand.

Excess capacity may exist in a low snow year or if sales are light. Similarly, capacity may be exceeded in a heavy snow year or if sales are high. Capacity may also be exceeded when customer expectations are higher than anticipated.

Different capacity types

No matter how large or how small a fleet is, the operator still needs to manage his or her equipment capacity.[3]
No matter how large or how small a fleet is, the operator still needs to manage his or her equipment capacity.

There are different types of capacity: financial, labour, managerial, etc., but this article will focus on equipment capacity. No matter how large or how small a fleet is, the operator still needs to manage his or her equipment capacity. This is an industry best practice. Below are several equipment capacity scenarios.

Equipment capacity is determined by five variables:

For example, there is a small fleet of pickup trucks with 2.6-m (8.5-ft) wing blades on them (i.e. equipment type). Next, the fleet consists of three trucks (i.e. number of units). Then, one can further assume the production data has been analyzed and a production rate of 6970 m2 (75,000 sf) per hour has been assigned to these trucks for a small snowfall. Finally, there are 12 ha (30 acres) to plow (i.e. area). What is the cycle time, not including drive time between properties?

Twelve hectares equals just over 120,775 m2 (1.3 million sf). Dividing by the production rate of 6970 m2 per hour gives 17.42 hours of capacity demand. Dividing 17.42 by the three trucks equals 5.81 hours of cycle time per truck.

Production rates decrease in heavier snowfalls, and cycle time increases accordingly, but by how much? What does the math look like? For example, if the production rate is cut in half, from 6970 m2 to 3483.9 m2 (37,500 sf) per hour, what happens to the cycle time?

Instead of 17.42 total hours or 5.81 hours per truck of capacity demand, there is 34.85 hours of capacity demand or 11.62 hours per truck of cycle time. Is this going to be acceptable to clients? Probably not. It might be better to take a different approach to this.

Instead of trying to figure out the cycle time for a certain number of acres, one could set the cycle time at a certain number of hours and calculate the amount of area that can be covered. How much area can be covered at 6970 m2 per hour with three trucks and a four-hour cycle time?

Instead of trying to figure out the cycle time for a certain number of acres, one could set the cycle time at a certain number of hours and calculate the amount of area that can be covered.[4]
Instead of trying to figure out the cycle time for a certain number of acres, one could set the cycle time at a certain number of hours and calculate the amount of area that can be covered.

Multiplying the three trucks by a production rate of 6970 m2 per hour gives a total of 20,903 m2 (225,000 sf) per hour of production. In four hours of time, 8.4 ha (20.7 acres) can be plowed. It is important to keep in mind if the production rate was cut in half, the number of acres that could be produced in four hours would also be cut in half to just over 4 ha (10 acres).

If 12 ha of work has been sold and the operator is trying to figure out how many trucks he or she needs, there is a third way to think about equipment capacity. In this example, the operators know everything except the number of trucks needed. Twelve hectares equals just over 120,775 m2, and dividing by the production rate of 6970 m2 per hour gives 17.42 hours of capacity demand. Divided by the four hours of cycle time equals 4.36 trucks. In other words, the three trucks will not get the job done. In fact, if the production rate was cut in half due to a heavy storm, almost nine trucks would be needed to maintain a four-hour cycle time.

Building flexibility into capacity

There are many ways to build flexibility into capacity calculations. One proven strategy is to hire subcontractors, as they allow an operator to increase his or her capacity without buying additional equipment. To eliminate assumptions, it is important to clarify what equipment each subcontractor has available to dedicate to him or her, what production rates are to be expected, and in what geographic areas the subcontractor operates.

Some contractors take the position of capacity being unlimited due to a perception subcontractors are readily available. In this author’s experience, selling work beyond capacity without having subcontractors lined up ahead of time is risky business. One needs to understand there is uncertainty inherent in the unlimited-capacity approach. Most snow and ice professionals want to reduce their risks, not increase them.

Reducing risk

One of the ways to reduce risk is to have some extra capacity. How much extra capacity is enough? What is optimal? Some extra capacity is desirable, but not too much.

Getting a handle on capacity, cycle time, and client expectations will go a long way to prevent problems and the associated blame game.[5]
Getting a handle on capacity, cycle time, and client expectations will go a long way to prevent problems and the associated blame game.

The Major League Baseball’s (MLB’s) Cleveland Indians provide a good example of too much unused capacity. With only 45.6 per cent of the capacity of Progressive Field used in 2012, the Indians have the lowest attendance in MLB based on capacity use. (There were, however, two teams actually over 100 per cent capacity use for the entire 2012 season: the Philadelphia Phillies at 100.8 per cent and the Boston Red Sox at 101.4 per cent.)

In the snow and ice management business, a rule of thumb is to have 10 to 20 per cent of reserve capacity. What may actually be needed is 50 per cent reserve capacity, depending on how capacity is calculated to begin with and what the expectations of the clients are. One should keep in mind primary equipment is that which is dedicated to specific sites to do work, whereas secondary equipment is allocated in reserve or for less intensive work during a storm—where it could be elevated to primary status if needed.

One piece of equipment may have both primary and secondary roles during a snow event. For example, managers may be assigned an hour or two of plowing as a primary role before moving into a secondary role as a supervisor. As a supervisor in a plow truck, they have reserve capacity.

Preventing problems

The snow business can be very unforgiving. Mistakes may result in slip-and-fall accidents, property damage, or damaged reputations. Getting a handle on capacity, cycle time, and client expectations will go a long way to prevent problems and the associated blame game. At the end of the day, and at the end of the season, everyone wants to be rated as excellent by both the customers and accountants.

[6]Phil Harwood is the president and CEO of Pro-Motion Consulting. Before founding his consulting firm, Harwood was part owner of a landscape and snow management firm, and also spent more than 10 years with a green industry retailer in various management positions. He can be reached via e-mail at phil@mypmcteam.com[7].

Endnotes:
  1. [Image]: https://www.poolspamarketing.com/wp-content/uploads/2018/11/bigstock-Snow-Plow-1328058.jpg
  2. [Image]: https://www.poolspamarketing.com/wp-content/uploads/2018/11/bigstock-219885727.jpg
  3. [Image]: https://www.poolspamarketing.com/wp-content/uploads/2018/11/bigstock-Snow-covered-Streets-after-sno-117100388.jpg
  4. [Image]: https://www.poolspamarketing.com/wp-content/uploads/2018/11/bigstock-223696477.jpg
  5. [Image]: https://www.poolspamarketing.com/wp-content/uploads/2018/11/dreamstime_l_39050834.jpg
  6. [Image]: https://www.poolspamarketing.com/wp-content/uploads/2018/11/Harwood_Headshot.jpg
  7. phil@mypmcteam.com: mailto:phil@mypmcteam.com

Source URL: https://www.poolspamarketing.com/trade/features/snow-maintenance-services/